Chapter 2
Signs and Patterns of Lung Disease
Learning Objectives
- Recognize the air bronchogram sign on a chest radiograph and computed tomographic (CT) scan and that the sign indicates a lung parenchymal process, including nonobstructive atelectasis, as distinguished from pleural or mediastinal processes.
- Recognize the air crescent sign on a chest radiograph and CT scan as a sign of a cavity within the lung, often caused by fungal infection.
- Recognize the continuous diaphragm sign on a chest radiograph and that the sign represents pneumomediastinum.
- Recognize the CT angiogram sign on a CT scan and state the mechanism of how the sign is produced (e.g., enhancing pulmonary vessels against a background of low-attenuation material in the lung).
- Recognize the deep sulcus sign on a supine chest radiograph and that the sign represents pneumothorax.
- Recognize the fallen lung sign on a chest radiograph and CT scan and that the sign represents a fractured bronchus.
- Recognize the flat waist sign on a chest radiograph and that the sign represents lower lobe collapse.
- Recognize the finger-in-glove sign on a chest radiograph and CT scan and that the sign represents bronchial impaction, which is seen in allergic bronchopulmonary aspergillosis.
- Recognize the S sign of Golden on a chest radiograph and that the sign represents lobar collapse, potentially caused by an obstructing endobronchial carcinoma in an adult.
- Recognize the halo sign on a CT scan and that the sign suggests the diagnosis of invasive pulmonary aspergillosis in a leukemic patient.
- Recognize the Hampton hump sign on a chest radiograph and CT scan and that the sign represents hemorrhagic edema or pulmonary infarction as a result of pulmonary embolism.
- Recognize the luftsichel sign on a chest radiograph and that the sign is associated with upper lobe collapse, potentially caused by an obstructing endobronchial carcinoma in an adult.
- Recognize air around the pulmonary artery on frontal and lateral chest radiographs and CT scan as the ring around the artery sign and that the sign represents pneumomediastinum.
- Recognize loss of the contour of the heart or diaphragm as the silhouette sign, and localize a lung parenchymal process by knowing that a process involving the medial segment of the right middle lobe obscures the right heart border, lingular processes obscure the left heart border, and basilar segmental lower lobe processes obscure the diaphragm.
- Recognize the split pleura sign on a CT scan as a sign of empyema or other exudative pleural effusion.
- Recognize the Westermark sign on a chest radiograph and CT scan as a sign of focal oligemia that is potentially caused by pulmonary embolism.
- Recognize the honeycomb pattern on a chest radiograph and CT scan as a sign of pulmonary fibrosis.
- Recognize the pattern of septal thickening on a chest radiograph and CT scan as representing thickening of the interlobular septae (Kerley lines) and suggesting the diagnosis of pulmonary edema with smooth septal thickening and lymphangitic carcinomatosis with beaded septal thickening.
- Recognize a cystic pattern on a chest radiograph and CT scan as suggesting the diagnosis of lymphangioleiomyomatosis in a female patient and Langerhan cell histiocytosis when nodules and an upper lung distribution are seen in a cigarette smoker.
- Recognize a nodular pattern on a CT scan; classify the nodules as perilymphatic, random, centrilobular, or bronchovascular in distribution; and list an appropriate differential diagnosis for each.
- Recognize a mosaic pattern of lung attenuation on a CT scan, which suggests an infiltrative process, small airway disease, or pulmonary vascular disease, depending on the caliber of pulmonary vessels, presence of air trapping on expiration, other associated CT findings, and clinical history.
- Recognize the tree-in-bud pattern on a CT scan and list an appropriate differential diagnosis, indicating infection and aspiration as the most common causes.
P.17
A sign in chest radiology
refers to a radiographic and/or computed tomographic (CT) scan finding
that implies a specific pathologic process. Understanding the meaning
of a sign indicates comprehension of an important concept related to
the radiologic findings. Knowing the name of the sign is not as
important as recognizing and understanding the meaning of the
radiologic findings, but it will help in communicating with clinicians
and radiologists who use the "sign" terminology. A CT "pattern" refers
to a nonspecific radiologic finding or collection of findings
suggesting one or more specific disease processes. The material that
follows is not an all-inclusive list but represents a collection of the
more common and useful signs and patterns of focal and diffuse lung
disease.
Air Bronchogram Sign
This sign refers to a branching, linear, tubular lucency
representing a bronchus or bronchiole passing through airless lung
parenchyma (Fig. 2-1). This sign does not
differentiate nonobstructive atelectasis from other abnormal
parenchymal opacities such as pneumonia. An air bronchogram indicates
that the underlying opacity must be parenchymal rather than pleural or
mediastinal in location. Although cancers tend to be solid masses, air
bronchograms are a characteristic feature of lymphoma and
bronchoalveolar cell carcinoma.
Air Crescent Sign
A mass growing within a pre-existing cavity, or an area
of pneumonia that undergoes necrosis and cavitates, may form a
peripheral crescent of air between the intracavitary mass and the
cavity wall, resulting in the air crescent sign (Fig. 2-2).
Intracavitary masses are most often caused by mycetomas. In
immunocompromised patients with invasive aspergillosis, the appearance
of the air crescent sign, representing necrosis and cavitation,
indicates recovery of the immune system and white blood cell response
to the infection.
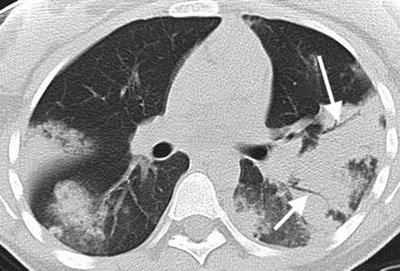 |
FIGURE 2-1. Air bronchogram sign. CT of the chest shows bilateral subpleural areas of airspace opacity with air bronchograms (arrows)
resulting from acute eosinophilic pneumonia. Air bronchograms can also
be seen with other causes of airspace disease, including infectious
pneumonia, hemorrhage, edema, bronchoalveolar cell carcinoma, lymphoma,
lipoid pneumonia, "alveolar" sarcoidosis, and alveolar proteinosis and
can also be seen in atelectasis not caused by central obstruction. The
presence of the sign indicates that the process is parenchymal in
location, rather than mediastinal or pleural. |
Bulging Fissure Sign
Historically, the bulging fissure sign was seen as a result of pne-umonia caused by Klebsiella pneumoniae involving the right upper lobe (Fig. 2-3).
Also called Friedländer pneumonia, the disease is often confined to one
lobe, with consolidation spreading rapidly, causing lobar expansion and
bulging of the adjacent fissure inferiorly (1). Because of timely antibiotic treatment, pneumonia rarely progresses to this state.
Continuous Diaphragm Sign
This sign is seen as a continuous lucency outlining the base of the heart, representing pneumomediastinum (Fig. 2-4). Air in the mediastinum tracks extrapleurally, between the heart and diaphragm (2). Pneumopericardium can have a similar appearance but will show air circumferentially outlining the heart.
CT Angiogram Sign
This sign refers to the identification of vessels within an airless portion of lung on contrast-enhanced CT (Fig. 2-5). The vessels are prominently seen against a background of low-attenuation material (3,4).
This sign has been associated with bronchoalveolar cell carcinoma and
lymphoma, but it can also be seen with other processes, including many
infectious pneumonias.
Deep Sulcus Sign
This sign refers to a deep, sometimes fingerlike
collection of intrapleural air (pneumothorax) in the costophrenic
sulcus as seen on the supine chest radiograph (5).
In the supine patient, air rises to the nondependent anteromedial
basilar pleural space and may not cause displacement of the visceral
pleural line laterally or at the apex, as seen on upright chest
radiographs (Figs. 2-6 and 2-7). When present, this sign may represent a pneumothorax that is much larger than initially expected.
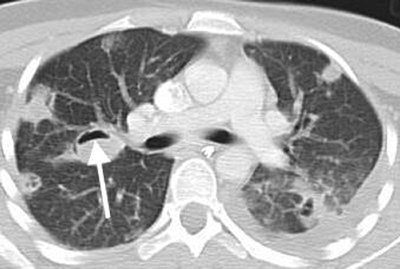 |
FIGURE 2-2. Air crescent sign.
CT of the chest shows bilateral pulmonary nodules in a predominantly
subpleural distribution resulting from septic emboli. Some of the
nodules are cavitary. A resulting crescent of air (arrows) is contained within and outlined by the thin cavity wall. |
P.18
 |
FIGURE 2-3. Bulging fissure sign. A: Posteroanterior (PA) chest radiograph shows dense opacification of the right upper lobe resulting from Klebsiella pneumonia. The inflammatory process is extensive and results in expansion of the lobe and bulging of the fissure inferiorly (arrows). B: Lateral view shows bulging of the superior portion of the major fissure inferiorly (larger arrows). The right upper lobe is outlined by the superior portion of the major fissure and the minor fissure (arrowheads). The middle lobe is outlined by the inferior portion of the major fissure (smaller arrows)
and the minor fissure. The right lower lobe is outlined by the major
fissure, which is divided into superior and inferior portions by the
minor fissure. |
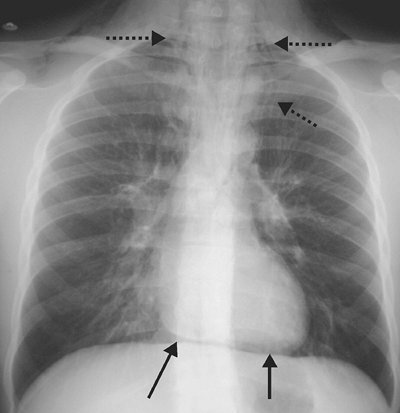 |
FIGURE 2-4. Continuous diaphragm sign. In this patient with pneumomediastinum, a continuous lucency is seen between the heart and the diaphragm (solid arrows). Air in the mediastinum is also seen tracking into the neck bilaterally (dashed arrows). |
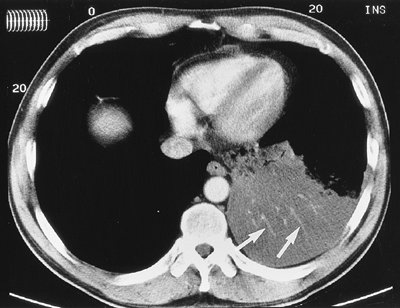 |
FIGURE 2-5. CT angiogram sign.
CT with intravenous contrast shows opacification of the left lower lobe
from bronchoalveolar cell carcinoma. The pulmonary vessels (arrows)
are seen prominently against a background of low-attenuation mucus
within the tumor. Other processes producing low-attenuation material
within the lung can also produce this sign, including lymphoma, lipoid
pneumonia, and bacterial pneumonia. |
P.19
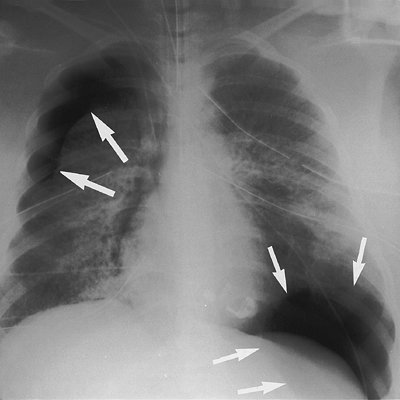 |
FIGURE 2-6. Deep sulcus sign.
Anteroposterior (AP) supine chest radiograph shows bilateral
pneumothoraces (intrapleural air) as a result of barotrauma from
mechanical ventilation. On the right, the visceral pleura is separated
from the parietal pleura by intrapleural air along the apicolateral
chest wall (larger arrows). On the left, the intrapleural air is collecting at the lung base, expanding the costophrenic sulcus (smaller arrows). The stiff lungs do not collapse completely in this patient with acute respiratory distress syndrome. |
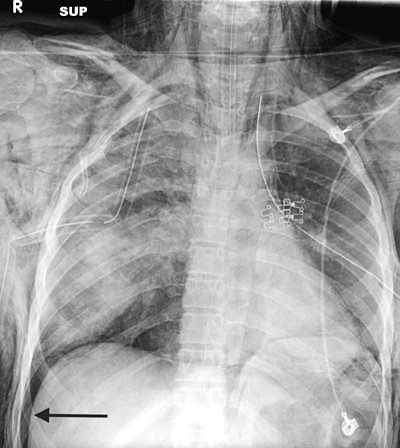 |
FIGURE 2-7. Deep sulcus sign. AP supine chest radiograph of a patient involved in chest trauma shows a right basilar pneumothorax (arrow),
which expands the costophrenic sulcus, creating a tonguelike extension
of air that continues inferiorly along the right lateral chest wall.
Note bilateral lung contusion, pneumomediastinum, and bilateral
subcutaneous emphysema. |
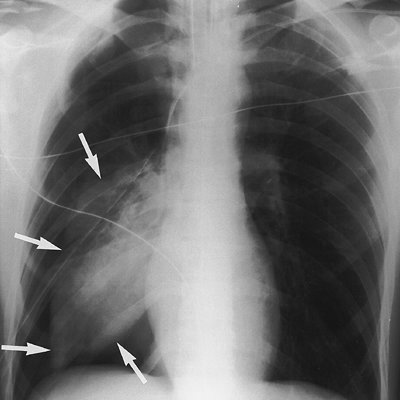 |
FIGURE 2-8. Fallen lung sign.
AP supine chest radiograph of a man involved in a motor vehicle
accident. There is a large pneumothorax on the right, which persists
with adequate chest tube placement, as a result of a fractured right
mainstem bronchus. The lung has collapsed inferiorly and laterally (arrows), instead of toward the hilum, because it is hanging from a fractured pedicle (bronchus). |
Fallen Lung Sign
This sign refers to the appearance of the collapsed lung occurring with a fractured bronchus (6).
The bronchial fracture results in the lung "falling" away from the
hilum, either inferiorly and laterally in an upright patient (Fig. 2-8) or posteriorly, as seen on CT in a supine patient. Normally, a pneumothorax causes a lung to collapse inward toward the hilum.
Flat Waist Sign
This sign refers to flattening of the contours of the aortic knob and adjacent main pulmonary artery (Fig. 2-9). It is seen in severe collapse of the left lower lobe and is caused by leftward displacement and rotation of the heart (7).
Finger-in-Glove Sign
In allergic bronchopulmonary aspergillosis, a clinical disorder secondary to Aspergillus
hypersensitivity, the bronchi become impacted with mucus, cellular
debris, eosinophils, and fungal hyphae. The impacted bronchi appear
radiographically as opacities with distinctive shapes (Fig. 2-10), variously described as "gloved finger," "Y," "V," "inverted V," "toothpaste," and so forth (8).
P.20
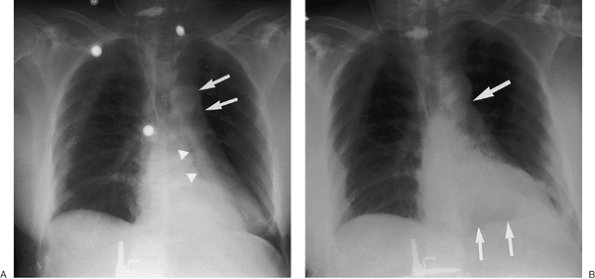 |
FIGURE 2-9. Flat waist sign. A:
Frontal chest radiograph shows left lower lobe opacification from left
lower lobe collapse. Note loss of the medial contour of the left
hemidiaphragm, which is known as the silhouette sign. The left lower lobe bronchus has a more vertical course than normal (arrowheads).
Leftward displacement and rotation of the heart in left lower lobe
collapse results in flattening of the contours of the aortic knob and
adjacent main pulmonary artery (arrows), termed the flat waist sign. B:
Frontal chest radiograph obtained 1 day later shows partial
re-expansion of the left lower lobe. The medial left hemidiaphragm is
now visible (smaller arrows). There is a notch between the aorta and the pulmonary artery (larger arrow) and no flat waist sign. |
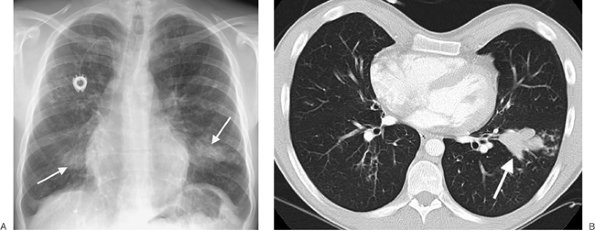 |
FIGURE 2-10. Finger-in-glove sign. A:
PA chest radiograph of a patient with cystic fibrosis and allergic
bronchopulmonary aspergillosis. Bronchi impacted and distended with
mucus, cellular debris, eosinophils, and fungal hyphae produce tubular
or masslike opacities, as seen in both lower lobes (arrows). Also shown is diffuse bronchiectasis related to cystic fibrosis. B: CT scan of the same patient shows dilated and impacted central bronchi in the left lower lobe (arrow). |
P.21
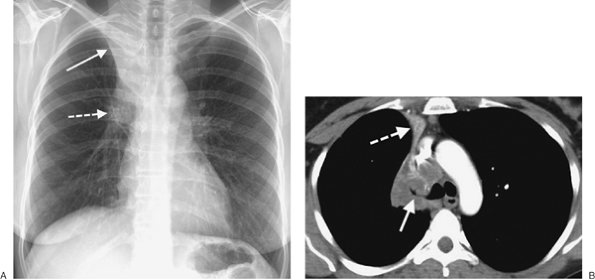 |
FIGURE 2-11. Golden S sign. A:
PA chest radiograph of a man with bronchogenic carcinoma of the right
upper lobe. The endobronchial tumor causes collapse of the right upper
lobe, and upward displacement of the minor fissure (solid arrow). The tumor mass produces a convex margin toward the lung at the right hilum (dashed arrow).
The contour of the displaced fissure and central mass creates a reverse
S shape. Note the elevation of the right hemidiaphragm, another sign of
right upper lobe volume loss. B: CT of the chest shows tumor encasing and occluding the right upper lobe bronchus (solid arrow) and collapse of the right upper lobe, with superior and medial displacement of the minor fissure (dashed arrow). |
Golden S Sign
When a lobe collapses around a large central mass, the
peripheral lung collapses and the central portion of lung is prevented
from collapsing by the presence of the mass (Fig. 2-11).
The relevant fissure is concave toward the lung peripherally but convex
centrally, and the shape of the fissure resembles an S or a reverse S (9).
This sign is important because it signifies the presence of a central
obstructing mass that, in an adult, may represent bronchogenic
carcinoma.
Halo Sign
This sign refers to ground-glass attenuation on CT
scanning that surrounds, or forms a halo around, a denser nodule or
area of consolidation (Fig. 2-12). Although most hemorrhagic pulmonary nodules produce this sign (10), when seen in patients with acute leukemia, the halo sign suggests early invasive pulmonary aspergillosis (11).
Hampton Hump Sign
Pulmonary infarction secondary to pulmonary embolism
produces an abnormal area of opacification on the chest radiograph,
which is always in contact with the pleural surface (Fig. 2-13).
The opacification may assume a variety of shapes. When the central
margin is rounded, a "hump" is produced, as described by Hampton and
Castleman (12).
Juxtaphrenic Peak Sign
This sign refers to a small triangular shadow that obscures the dome of the diaphragm (Fig. 2-14), secondary to upper lobe atelectasis (13).
The shadow is caused by traction on the lower end of the major fissure,
the inferior accessory fissure, or the inferior pulmonary ligament.
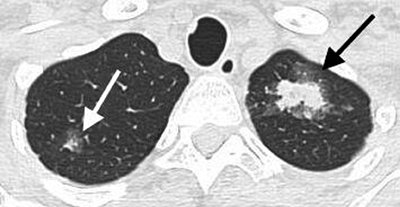 |
FIGURE 2-12. Halo sign. CT shows nodular consolidation associated with a halo of ground-glass opacity (GGO) in both apices (arrows)
resulting from invasive pulmonary aspergillosis. This halo represents
hemorrhage and, when seen in leukemic patients, is highly suggestive of
the diagnosis of invasive pulmonary aspergillosis. |
P.22
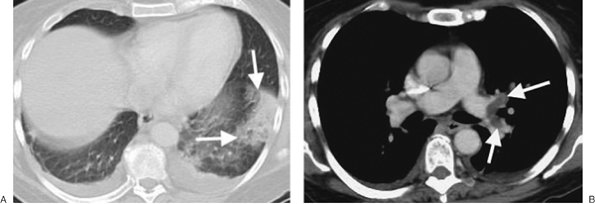 |
FIGURE 2-13. Hampton hump sign. A: CT with lung windowing shows a focal subpleural area of consolidation in the left lower lobe (arrows).
This hump-shaped area of opacification represents pulmonary infarction
secondary to pulmonary embolism. There are also small bilateral pleural
effusions, which are commonly seen with acute pulmonary emboli. B: CT with mediastinal windowing shows low-attenuation filling defect, which represents a saddle embolus (arrows) bridging the lingular and left lower lobe pulmonary arteries. |
Luftsichel Sign
In left upper lobe collapse, the superior segment of the
left lower lobe, which is positioned between the aortic arch and the
collapsed left upper lobe, is hyperinflated. This aerated segment of
left lower lobe is hyperlucent and shaped like a sickle, where it
outlines the aortic arch on the frontal chest radiograph (Fig. 2-15). This peri-aortic lucency has been termed the luftsichel sign, derived from the German words luft (air) and sichel (sickle) (14).
Although this sign can also be seen on the right, it is more common on
the left because of the difference in anatomy and the presence of a
minor fissure on the right. This sign and associated findings of upper
lobe collapse signify the probable diagnosis of bronchogenic carcinoma
in an adult.
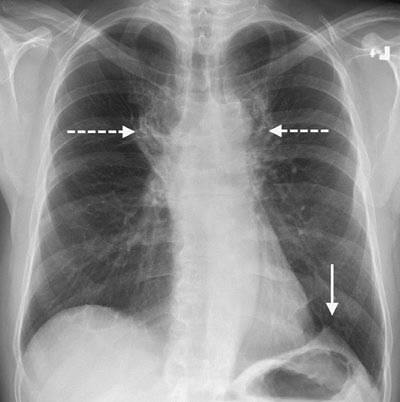 |
FIGURE 2-14. Juxtaphrenic peak sign. PA chest radiograph of a man treated with mediastinal radiation shows paramediastinal radiation fibrosis (dashed arrows) and upward retraction of both hila. There is tenting of the left hemidiaphragm (solid arrow), indicating a loss of left upper lobe volume, seen as the juxtaphrenic peak sign. |
Melting Ice Cube Sign
This sign refers to the appearance of a resolving
pulmonary infarct on a chest radiograph or CT scan, which looks like an
ice cube that is melting peripherally to internally (Fig. 2-16). This is distinguished from the pattern of resolving pneumonia, where the opacification disappears in a patchy fashion (15).
Ring Around the Artery Sign
This sign refers to a well-defined lucency encircling the right pulmonary artery (Fig. 2-17), as seen on frontal and lateral chest radiographs, representing pneumomediastinum (16).
Silhouette Sign
Felson and Felson (17) popularized the term silhouette sign
to indicate an obliteration of the borders of the heart, other
mediastinal structures, or diaphragm by an adjacent opacity of similar
density. An intrathoracic lesion not anatomically contiguous with a
border of one of these structures will not obliterate that border.
Parenchymal processes involving the medial segment of the right middle
lobe obliterate the right heart border (Fig. 2-18). If the lingula is involved, the left heart border is obliterated (Fig. 2-19).
Lower lobe processes involving one or more basilar segments result in
obliteration of all or a part of the border of the diaphragm.
P.23
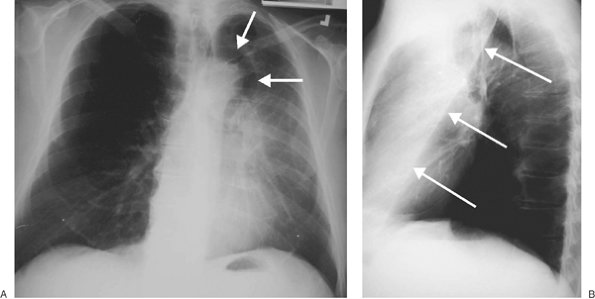 |
FIGURE 2-15. Luftsichel sign. A: PA chest radiograph shows a crescentic lucency adjacent to the aortic arch (arrows),
representing hyperaeration of the superior segment of the left lower
lobe, which is positioned between the aortic arch medially and the
collapsed left upper lobe laterally. There is hazy opacification of the
left lung (sparing the apex and costophrenic angle), elevation of the
left hemidiaphragm, and partial obscuration of the left heart border
(the silhouette sign), indicating a loss of left upper lobe volume. B: Lateral view shows anterior displacement of the major fissure (arrows).
The superior extent of the displaced fissure indicates extension of the
superior segment of the lower lobe to the lung apex. The luftsichel
sign is just one sign of upper lobe collapse. The associated signs of
volume loss make the diagnosis obvious. In an adult, left upper lobe
collapse is highly suggestive of an obstructing bronchogenic carcinoma. |
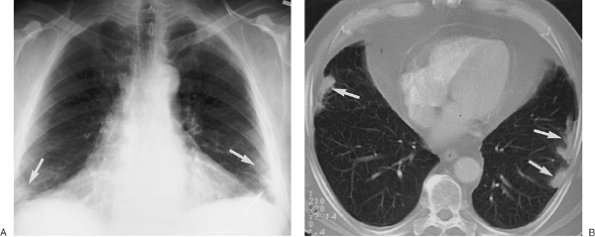 |
FIGURE 2-16. Melting ice cube sign. A:
PA chest radiograph of a 69-year-old man with a 6-week history of
cough, pleuritic chest pain, and hemoptysis shows bilateral, subpleural
airspace opacities at the costophrenic angles (arrows), representing parenchymal infarcts. B: CT scan obtained 2 weeks later shows bilateral peripheral opacities (arrows),
an appearance typical of resolving pulmonary infarcts. Note that the
opacities are not wedge shaped or rounded, as expected with acute
infarcts. Infarcts resolve from the periphery inward, like a melting
ice cube. |
P.24
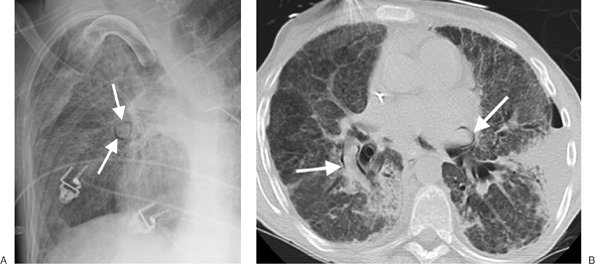 |
FIGURE 2-17. Ring around the artery sign. A:
PA chest radiograph of a patient with acute respiratory distress
syndrome shows a ring of lucency around the right pulmonary artery (arrows), signifying pneumomediastinum. B: CT confirms air surrounding both pulmonary arteries (arrows). |
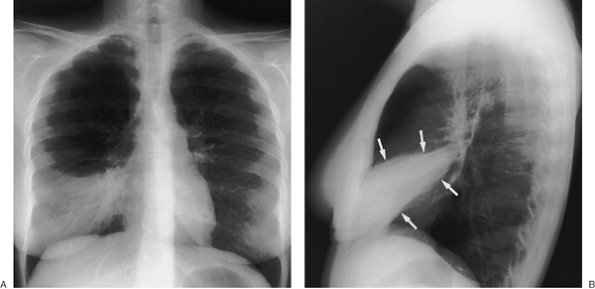 |
FIGURE 2-18. Silhouette sign. A:
PA chest radiograph of a patient with pneumococcal pneumonia shows
opacification of the right lower lung, which partially obscures the
right heart border (the silhouette sign), indicating a process
involving the right middle lobe. B: Lateral view shows a triangular opacity over the heart (arrows), confirming a right middle lobe process. |
P.25
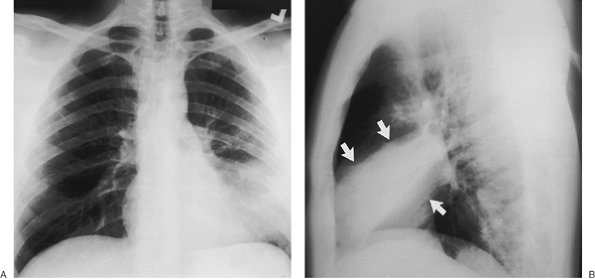 |
FIGURE 2-19. Silhouette sign. A:
PA chest radiograph of a patient with pneumonia shows opacification of
the left lower lung partially obscuring the left heart border
(silhouette sign), indicating a lingular process. Note that the left
hemidiaphragm is not obscured, as would be seen with a process
involving any of the basilar segments of the lower lobe. B: Lateral view shows an opacity over the heart (arrows), confirming the lingular location of the pneumonia. |
Split Pleura Sign
Normally, the thin visceral and parietal pleura cannot
be distinguished as two separate structures on CT scanning. With an
exudative pleural effusion, such as empyema (Fig. 2-20), the fluid separates or "splits" the thickened and enhancing pleural layers (18).
Westermark Sign
This sign refers to oligemia of the lung beyond an occluded vessel in a patient with pulmonary embolism (Fig. 2-21) (19).
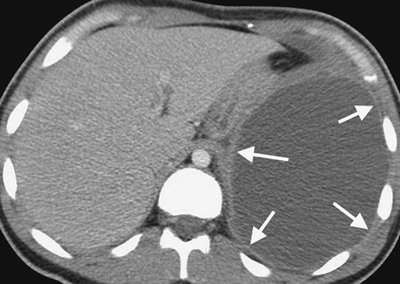 |
FIGURE 2-20. Split pleura sign.
CT with intravenous contrast shows empyema in an intrapleural location
with associated thickening, contrast enhancement, and separation of the
visceral and parietal pleura (arrows). |
Spine Sign
Lower lobe pneumonia may be poorly visualized on a
posteroanterior (PA) chest radiograph. In such cases, the lateral view
is often helpful when it shows the spine sign, which is an interruption
in the progressive increase in lucency of the vertebral bodies from
superior to inferior (Fig. 2-22) (20).
Patterns
The following patterns are not always isolated findings
on chest radiographs or CT scans. They commonly occur in combination
with other patterns and findings and may or may not represent the
predominant imaging feature.
Honeycomb Pattern
Honeycombing is characterized by the presence of cystic
airspaces with thick, clearly definable fibrous walls lined by
bronchiolar epithelium. It results from destruction of alveoli and loss
of acinar architecture and is associated with pulmonary fibrosis. The
cysts are typically layered along the pleural surface, helping to
distinguish them from the nonlayered subpleural lucencies seen with
paraseptal emphysema.
Honeycombing produces a characteristic appearance on CT that allows a confident diagnosis of lung fibrosis (Fig. 2-23) (21).
On CT, the cystic spaces usually average 1 cm in diameter, although
they can range from several millimeters to several centimeters in size.
They have clearly definable walls that are 1 to 3 mm thick, they are
air-filled, and they appear lucent in comparison to normal lung
parenchyma. Honeycombing is usually associated with other findings of
lung fibrosis, such as architectural distortion, intralobular
interstitial thickening, traction bronchiectasis, and irregular linear
opacities. Honeycombing on CT usually represents idiopathic pulmonary
fibrosis,
collagen vascular disease, asbestosis, chronic hypersensitivity pneumonitis, or drug-related fibrosis (Table 2-1).
P.26
P.27
collagen vascular disease, asbestosis, chronic hypersensitivity pneumonitis, or drug-related fibrosis (Table 2-1).
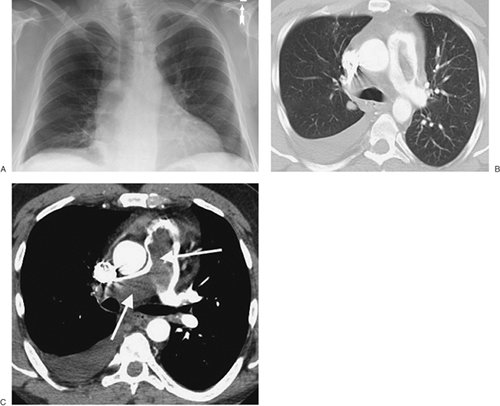 |
FIGURE 2-21. Westermark sign. A:
PA chest radiograph shows oligemia of the right lung, the so-called
Westermark sign. Note how the vessels on the right are diminutive
compared with those on the left. As a result, the right hemithorax
appears hyperlucent. B: CT with lung
windowing better shows the diminution of vessels on the right compared
with the left. There is also a right pleural effusion. C: CT with mediastinal windowing shows thrombus expanding and filling the main and right pulmonary arteries (arrows). |
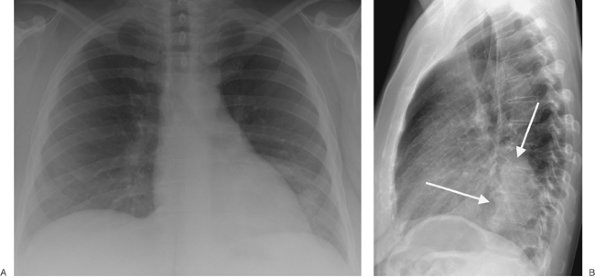 |
FIGURE 2-22. Spine sign. A: PA chest radiograph of a patient with left lower lobe pneumonia shows abnormal opacity in the left lower lung. B: Lateral view shows this opacity projected over the lower spine (arrows).
Normally, the spine becomes progressively more lucent from the top to
the bottom on the lateral view. The presence of increased opacity over
the lower spine is an indication of a lower lobe process, typically
pneumonia, and is called the spine sign. |
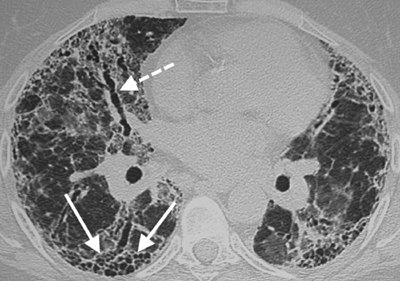 |
FIGURE 2-23. Honeycomb pattern. CT shows layers of subpleural cysts (solid arrows) representing the honeycomb pattern of pulmonary fibrosis. Also shown is traction bronchiectasis (dashed arrow), another sign of pulmonary fibrosis. |
TABLE 2-1 DIFFERENTIAL DIAGNOSIS OF PATTERNS OF DISEASE ON CT OF THE LUNGS | |
|---|---|
|
Septal Thickening
An interlobular septum marginates part of a secondary
pulmonary lobule and contains pulmonary veins and lymphatics. These
septa measure approximately 0.1 mm in thickness and are occasionally
seen on normal thin-section CT scans. Abnormal thickening of
interlobular septa is caused by fibrosis, edema, or infiltration by
cells or other material. Within the peripheral lung, thickened septa 1
to 2 cm in length may outline part or all of a secondary pulmonary
lobule, perpendicular to the pleural surface. They represent the CT
counterpart of Kerley B lines seen on chest radiographs.
Interlobular septal thickening can be smooth (Fig. 2-24) or nodular (22) (Table 2-1).
Smooth thickening is seen in patients with pulmonary edema or
hemorrhage, lymphangitic spread of carcinoma, lymphoma, leukemia,
interstitial infiltration associated with amyloidosis, and some
pneumonias. Nodular or "beaded" thickening occurs in lymphangitic
spread
of carcinoma (Fig. 2-25) or lymphoma, sarcoidosis, silicosis or coal worker's pneumoconiosis, lymphocytic interstitial pneumonia, and amyloidosis.
P.28
of carcinoma (Fig. 2-25) or lymphoma, sarcoidosis, silicosis or coal worker's pneumoconiosis, lymphocytic interstitial pneumonia, and amyloidosis.
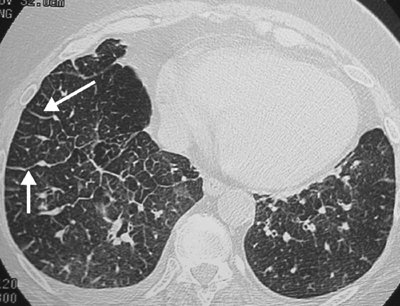 |
FIGURE 2-24. Smooth septal thickening. CT shows smooth thickening of the interlobular septae (arrows)
in this patient with pulmonary edema. There are also small pleural
effusions and scattered areas of GGO, which support the diagnosis. |
Cystic Pattern
The term "cyst" is nonspecific and refers to a
thin-walled (usually less than 3 mm thick), well-defined,
well-circumscribed, air- or fluid-containing lesion, 1 cm or more in
diameter, that has an epithelial or fibrous wall. A cystic pattern
results from a heterogeneous group of diseases that have in common the
presence of focal, multifocal, or diffuse parenchymal lucencies and
lung destruction (Table 2-1). Pulmonary
Langerhan cell histiocytosis, lymphangioleiomyomatosis, sarcoidosis,
lymphocytic interstitial pneumonitis, collagen vascular diseases, Pneumocystis
pneumonia, and honeycombing can manifest a cystic pattern on CT.
Although they do not represent true cystic disease, centrilobular
emphysema and cystic bronchiectasis mimic cystic disease on chest CT
scans.
In cases of Langerhan cell histiocytosis, the cysts are
often confluent, usually thin-walled, and often associated with
pulmonary nodules 1 to 5 mm in diameter that may or may not be cavitary
(Fig. 2-26). The intervening lung parenchyma is
typically normal, without evidence of fibrosis or septal thickening.
The distribution of findings is usually upper lungs, with sparing of
the costophrenic sulci. The cysts are distributed diffusely throughout
the lungs in lymphangioleiomyomatosis (Fig. 2-27),
and nodules are not a common feature. The "cystic" spaces seen with
centrilobular emphysema often contain a small nodular opacity
representing the centrilobular artery (Fig. 2-28). This finding is helpful in distinguishing emphysema from lymphangioleiomyomatosis and Langerhan cell histiocytosis.
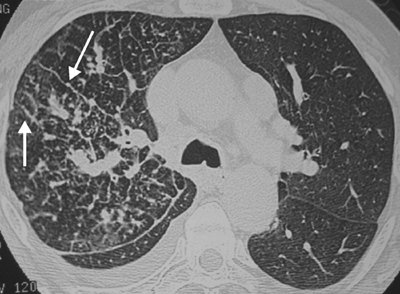 |
FIGURE 2-25. Nodular septal thickening. CT shows nodular thickening of the septae (arrows),
other scattered small nodules, and areas of GGO, involving only the
right lung. These findings are highly suggestive of this patient's
diagnosis: lymphangitic carcinomatosis associated with primary
bronchogenic carcinoma involving the right lung. Lymphangitic
carcinomatosis from an extrathoracic malignancy usually involves both
lungs. |
Nodular Pattern
A nodular pattern refers to
multiple round opacities, generally ranging in diameter from 1 mm to 1
cm, that may be very difficult to separate from one another as
individual nodules on a
chest radiograph because of superimposition but which are accurately diagnosed on CT. Nodular opacities may be described as miliary (1 to 2 mm, the size of millet seeds), small, medium, or large as the diameter of the opacity increases. Nodules can be further characterized according to their margins (e.g., smooth or irregular), presence or absence of cavitation, attenuation characteristics (such as ground-glass opacity [GGO] or calcification), and distribution (e.g., centrilobular, perilymphatic, or random) (23) (Table 2-1).
P.29
chest radiograph because of superimposition but which are accurately diagnosed on CT. Nodular opacities may be described as miliary (1 to 2 mm, the size of millet seeds), small, medium, or large as the diameter of the opacity increases. Nodules can be further characterized according to their margins (e.g., smooth or irregular), presence or absence of cavitation, attenuation characteristics (such as ground-glass opacity [GGO] or calcification), and distribution (e.g., centrilobular, perilymphatic, or random) (23) (Table 2-1).
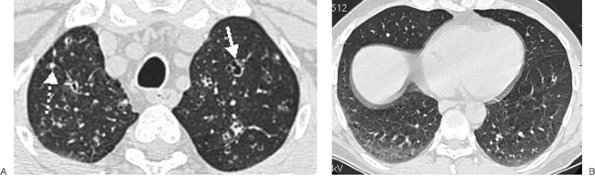 |
FIGURE 2-26. Cystic pattern. A: CT of this patient with Langerhan cell histiocytosis shows irregular, variably sized cysts with definable walls (solid arrow) and scattered small nodules (dashed arrow) involving both upper lungs. B:
CT at a level inferior to A shows normal lower lungs. The sparing of
the lower lungs and the combination of cysts and nodules is highly
suggestive of Langerhan cell histiocytosis. |
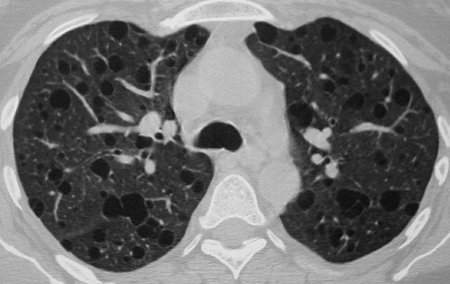 |
FIGURE 2-27. Cystic pattern.
CT scan of a woman with lymphangioleiomyomatosis shows fairly
homogeneous thin-walled cysts with normal intervening lung parenchyma.
The cysts involve the upper and lower lungs equally (not shown). |
Multiple small smooth or irregularly marginated nodules in a perilymphatic distribution are characteristic of sarcoidosis (Fig. 2-29).
The nodules represent the coalescence of microscopic noncaseating
granulomas distributed along the bronchoarterial bundles, interlobular
septa, and subpleural regions. A similar appearance can be seen with
silicosis or coal worker's pneumoconiosis, although with the latter,
the distribution of nodules is random, with predominant upper lung zone
involvement. Within affected areas, the nodules of silicosis can show a
predominantly posterior distribution. As disease progresses,
coalescence of the silicotic nodules leads to progressive massive
fibrosis. Numerous small nodules of GGO in a centrilobular distribution
are characteristic of the acute or subacute stage of extrinsic allergic
alveolitis (Fig. 2-30) or respiratory
bronchiolitis. The nodules are poorly defined and usually measure less
than 3 mm in diameter. A random distribution of miliary nodules can be
seen with hematogenous spread of tuberculosis (Fig. 2-31),
fungal infection, or metastases from a variety of primary sources. When
associated with irregularly shaped, thin-walled cysts, randomly
distributed nodules suggest Langerhan cell histiocytosis. Multiple
cavitary nodules can be seen with metastases (usually of squamous cell
histology), Wegener granulomatosis, rheumatoid lung disease, septic
emboli, and multifocal infection (typically of fungal or mycobacterial
etiology). Multiple irregular nodules in a bronchovascular distribution
are characteristic of benign lymphoproliferative disorders (Fig. 2-32), lymphoma, leukemia, and Kaposi sarcoma.
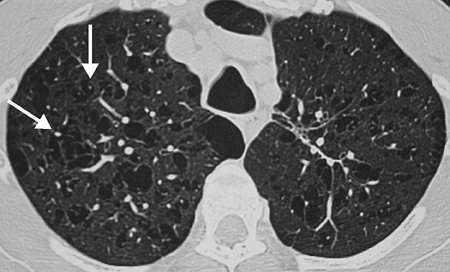 |
FIGURE 2-28. Cystic pattern look-alike.
CT scan shows lucent areas throughout both lungs, which can
occasionally be confused with true lung cysts. However, the lucent
areas do not have circumferential walls and in some areas, the
centrilobular artery is visible within the area of lucency (arrows). These findings, along with a distribution that is predominantly in the upper lungs, are typical of centrilobular emphysema. |
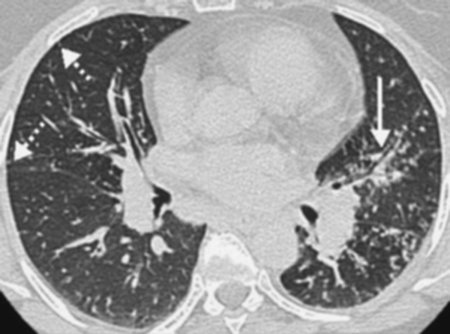 |
FIGURE 2-29. Perilymphatic nodular pattern. CT scan of a young man with sarcoidosis shows numerous small nodules distributed along the bronchovascular bundles (solid arrow) and subpleural lung (dashed arrows). This is a perilymphatic distribution, which is typical of sarcoidosis. |
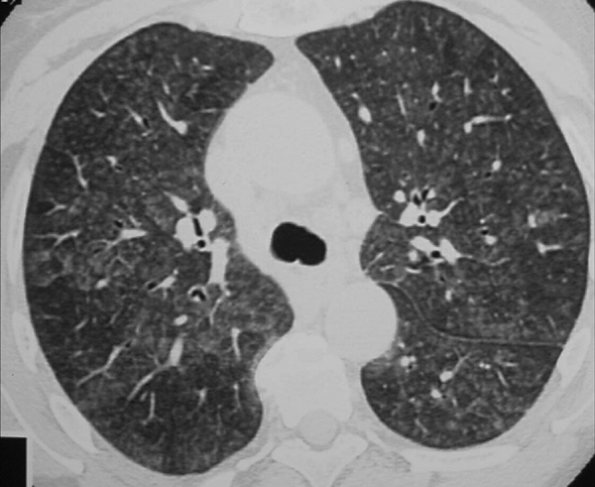 |
FIGURE 2-30. Centrilobular nodular pattern.
CT scan of a man with acute hypersensitivity pneumonitis (also called
extrinsic allergic alveolitis) shows numerous ill-defined ground-glass
nodules in a centrilobular distribution. This appearance is highly
suggestive of the diagnosis but can also be seen in respiratory
bronchiolitis. A history of exposure and the presence or absence of
cigarette smoking help to make the correct diagnosis. |
P.30
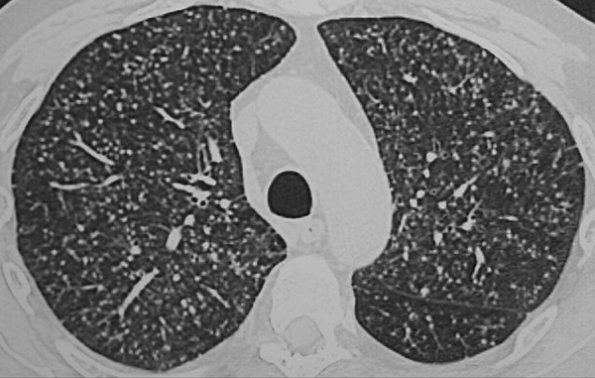 |
FIGURE 2-31. Random nodular pattern.
CT scan of a patient with miliary tuberculosis shows a pattern of
diffuse, randomly distributed, well-defined small pulmonary nodules.
Some of the nodules appear centrilobular and some are subpleural in
location. The same pattern can be seen with fungal infection or
pulmonary metastases. |
Ground-Glass Pattern
GGO is defined as “hazy increased attenuation of lung,
with preservation of bronchial and vascular margins; caused by partial
filling of airspaces, interstitial thickening, partial collapse of
alveoli, normal expiration, or increased capillary blood volume; not to
be confused with consolidation, in which bronchovascular margins are
obscured; may be associated with an air bronchogram” (24). GGO is a common but nonspecific finding on CT that reflects the presence of abnormalities below the limit of CT resolution (Table 2-1).
In one investigation of patients with chronic infiltrative lung disease
in whom lung biopsy was performed in areas of GGO, the pattern was
shown to be caused by predominantly interstitial diseases in 54% of
cases, equal involvement of the interstitium and airspaces in 32%, and
predominantly airspace disease in 14% (25). GGO
is an important finding. In certain clinical circumstances, it can
suggest a specific diagnosis, indicate a potentially treatable disease,
and guide a bronchoscopist or surgeon to an appropriate area for biopsy
(26).
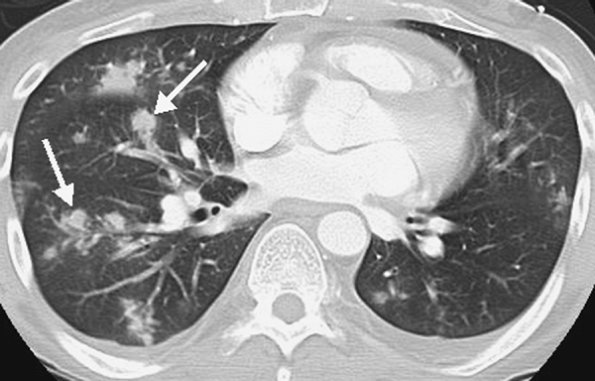 |
FIGURE 2-32. Bronchovascular nodular pattern.
CT scan of a patient with benign posttransplant lymphoproliferative
disorder shows multiple ill-defined nodules distributed along the
bronchovascular bundles (arrows). This appearance can also be seen with malignant lymphoma, leukemia, and Kaposi sarcoma. |
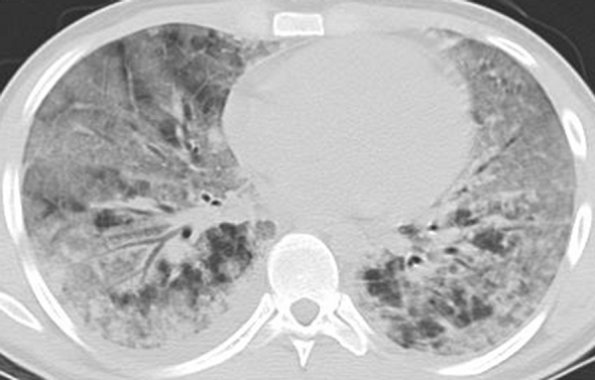 |
FIGURE 2-33. Ground-glass pattern.
CT scan of a patient with diffuse pneumonia shows extensive bilateral
GGO. Note that the pulmonary vessels and bronchi are still visible.
This is a nonspecific pattern that is also commonly seen with pulmonary
hemorrhage and pulmonary edema. |
Acute lung diseases characteristically associated with diffuse GGO include pneumonia (Fig. 2-33),
pulmonary hemorrhage, and pulmonary edema. In patients with acquired
immunodeficiency syndrome, the presence of focal or diffuse GGO on CT
is highly suggestive of Pneumocystis
pneumonia. In patients with lung transplants, GGO is very suggestive of
Cytomegalovirus pneumonia or acute rejection. When diffuse GGO is seen
in the first month after bone marrow transplantation, both infection
and diffuse alveolar hemorrhage should be considered.
Diffuse or patchy GGO is frequently the main abnormality
seen in the acute or subacute phase of extrinsic allergic alveolitis.
It is also the predominant finding in patients with desquamative
interstitial pneumonia, in which it reflects the presence of mild
interstitial thickening and filling of the airspaces with macrophages.
In pulmonary alveolar proteinosis, the areas of GGO usually have a
patchy or geographic distribution. Although the abnormality consists
mainly of filling of airspaces with proteinaceous material,
interlobular septal thickening is frequently identified on CT in the
areas of GGO, creating a "crazy paving" pattern (Fig. 2-34). Solitary small areas of GGO can signify early stage bronchioloalveolar carcinoma or atypical adenomatous hyperplasia (AAH).
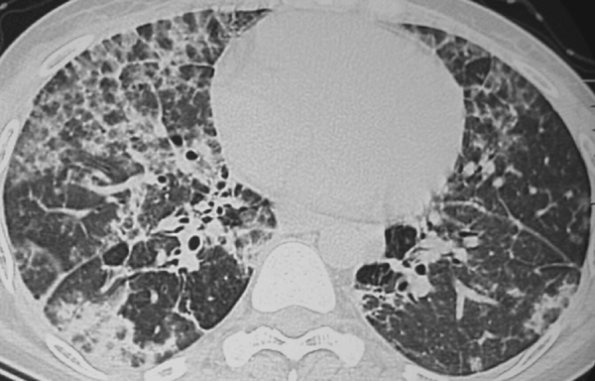 |
FIGURE 2-34. "Crazy paving" pattern.
CT scan of a patient with pulmonary alveolar proteinosis shows patchy
areas of GGO associated with septal thickening, so-called “crazy
paving.” This is a characteristic but not pathognomonic finding of
pulmonary alveolar proteinosis. |
P.31
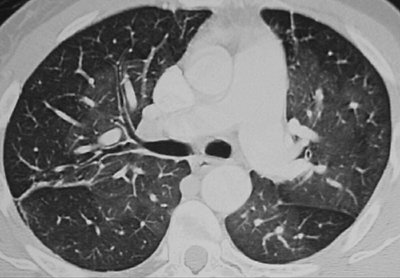 |
FIGURE 2-35. Mosaic perfusion pattern.
CT scan of a patient with sickle cell disease shows a mosaic pattern of
lung attenuation. The abnormal lucent areas represent decreased
perfusion secondary to microvascular occlusion. |
Mosaic Pattern of Lung Attenuation
Lung attenuation normally increases during exhalation.
In the presence of airway obstruction and air trapping, lung remains
lucent on exhalation and shows little change in cross-sectional area;
this is best appreciated when patchy and compared to normal lung. Areas
of air trapping are seen as relatively low in attenuation on expiratory
CT scans. Areas of air trapping can be patchy and nonanatomic; can
correspond to individual secondary pulmonary lobules, segments, and
lobes; or may involve an entire lung. Air trapping in a lobe or lung is
usually associated with large airway or generalized small airway
abnormalities, whereas lobular or segmental air trapping is associated
with diseases that affect small airways. Bronchiolectasis is a common
associated finding. Pulmonary vessels within the low-attenuation areas
of air trapping often appear small relative to vessels in the more
opaque normal lung regions (27). This finding
is also seen with vascular disease, such as chronic thromboembolic
disease, as a result of decreased perfusion to affected areas of lung.
The presence of heterogeneous lung attenuation on
inspiratory scans - the so-called mosaic pattern of lung attenuation - can
result from infiltrative processes, airway obstruction and reflex
vasoconstriction, mosaic perfusion resulting from vascular obstruction
(e.g., chronic thromboembolic disease; Fig. 2-35), or a combination of these (Table 2-1).
In patients with GGO from infiltrative processes, expiratory CT shows a
proportional increase in attenuation in areas of both increased and
decreased opacity. In patients with mosaic attenuation resulting from
airway disease, such as obliterative bronchiolitis or asthma,
attenuation differences are accentuated or seen only on expiration (Fig. 2-36).
In patients with mosaic perfusion caused by vascular disease, air
trapping can be seen but is not a dominant feature on expiratory CT.
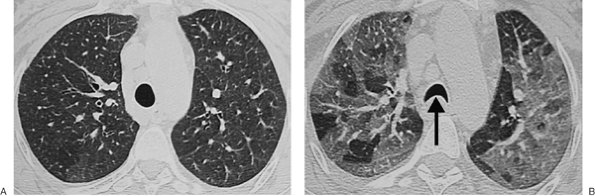 |
FIGURE 2-36. Mosaic attenuation pattern. A: Inspiratory CT scan of a patient with asthma shows a homogeneous pattern of lung attenuation. B:
Expiratory CT scan shows a mosaic pattern of lung attenuation. The
abnormal lucent areas represent air trapping related to the patient's
asthma. Note the anterior bowing of the posterior membranous trachea (arrow), indicating expiration. |
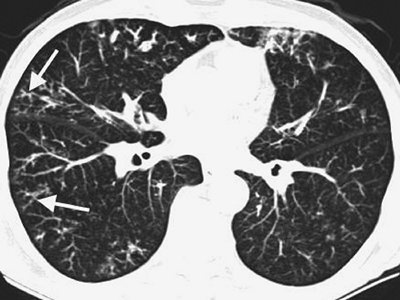 |
FIGURE 2-37. Tree-in-bud pattern.
Maximum-intensity projection axial CT image of a patient with bacterial
bronchiolitis shows a pattern of small nodular and linear branching
opacities, predominantly in the periphery of the lung (arrows). This is a bronchiolar distribution. The most common etiologies for this pattern are infection and aspiration. |
Tree-in-Bud Pattern
The CT pattern of centrilobular nodular and branching
linear opacities has been likened to the appearance of a budding tree.
Many disorders can result in this pattern, the most common being
infectious processes with endobronchial spread of disease (Fig. 2-37) (28,29) (Table 2-1). The common CT features of all processes producing the tree-in-bud pattern are (a) bronchiolar
dilatation and (b) impaction of bronchioles with mucus, pus, or other material. The CT findings are nonspecific, but a specific diagnosis can occasionally be suggested when the findings are correlated with patient history, clinical information, associated CT scan findings, and chronicity of disease.
P.32
dilatation and (b) impaction of bronchioles with mucus, pus, or other material. The CT findings are nonspecific, but a specific diagnosis can occasionally be suggested when the findings are correlated with patient history, clinical information, associated CT scan findings, and chronicity of disease.
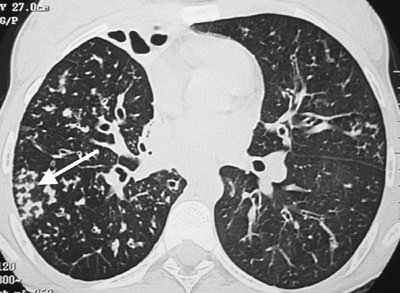 |
FIGURE 2-38. Tree-in-bud pattern.
CT scan of a patient with cystic fibrosis shows bilateral
bronchiectasis and bronchiolectasis, along with "tree-in-bud" opacities
in the periphery of the right lung (arrow). The opacities represent mucoid impaction of the bronchioles. |
The term tree-in-bud dates back to the bronchogram descriptions of normal respiratory bronchioles by Twining and Kerley (30) but has been more recently popularized by Im et al (31) to describe the CT appearance of the endobronchial spread of Mycobacterium tuberculosis.
Numerous noninfectious disorders are associated with the
tree-in-bud pattern. In allergic bronchopulmonary aspergillosis,
immunologic responses to the endobronchial growth of Aspergillus
sp result in damage to the bronchial wall, central bronchiectasis, and
the formation of mucous plugs that contain fungus and inflammatory
cells. The tree-in-bud pattern is seen when the process extends to the
bronchioles. In cystic fibrosis, an abnormally low water content of
airway mucus is at least partially responsible for decreased mucous
clearance, mucous plugging of small and large airways, and an increased
incidence of bacterial airway infection. Bronchial wall inflammation
progresses to bronchiectasis, and bronchiolar secretions result in a
tree-in-bud pattern (Fig. 2-38). The tree-in-bud pattern can also be seen with aspiration of infected oral secretions or other irritant material (Fig. 2-39), diffuse panbronchiolitis (Fig. 2-40), obliterative bronchiolitis, and asthma.
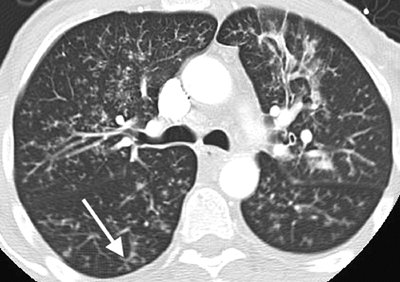 |
FIGURE 2-39. Tree-in-bud pattern. CT scan of a patient who aspirated shows extensive tree-in-bud pattern (arrow) bilaterally. |
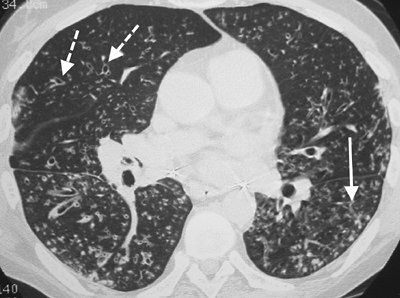 |
FIGURE 2-40. Tree-in-bud pattern. CT scan of a patient with diffuse panbronchiolitis shows tree-in-bud pattern (solid arrow) and dilated, nonimpacted bronchioles (dashed arrows). |
References
1. Felson LB, Rosenberg LS, Hamburger M. Roentgen findings in acute Friedlander's pneumonia. Radiology. 1949; 53:559–565.
2. Levin B. The continuous diaphragm sign: a newly recognized sign of pneumomediastinum. Clin Radiol. 1973;24:337–338.
3. Im JG, Han MC, Yu EJ. Lobar bronchioloalveolar carcinoma: "angiogram sign" on CT scans. Radiology. 1990;176:749–753.
4. Vincent JM, Ng YY, Norton AJ, et al. CT "angiogram sign" in primary pulmonary lymphoma. J Comput Assist Tomogr. 1992;16:829–831.
5. Gordon R. The deep sulcus sign. Radiology. 1980;136:25–27.
6. Oh KS, Fleischner FG, Wyman SM. Characteristic pulmonary finding in traumatic complete transection of a main stem bronchus. Radiology. 1969;92:371–372.
7. Armstrong P. Basic patterns in lung disease. In: Armstrong P, Wilson AG, Dee P, Hansell DM, eds. Imaging of Diseases of the Chest. 2nd ed. St. Louis, MO: Mosby; 1995:89.
8. Gefter WB. The spectrum of pulmonary aspergillosis. J Thorac Imaging. 1992;7:56–74.
9. Golden R. The effect of bronchostenosis upon the roentgen-ray shadows in carcinoma of the bronchus. Am J Roentgenol. 1925;13:21–30.
10. Primack SL, Hartman TE, Lee KS, Müller NL. Pulmonary nodules and the CT halo sign. Radiology. 1994;190:513–515.
11. Kuhlman
JE, Fishman EK, Siegelman SS. Invasive pulmonary aspergillosis in acute
leukemia: characteristic findings on CT, the CT halo sign, and the role
of CT in early diagnosis. Radiology. 1985;157:611–614.
12. Hampton
AO, Castleman B. Correlations of post mortem chest teleroentgenograms
with autopsy findings with special reference to pulmonary embolism and
infarction. Am J Roentgenol. 1940;43:305–326.
13. Kattan KR, Eyler WR, Felson B. The juxtaphrenic peak in upper lobe collapse. Semin Roentgenol. 1980;15:187–193.
14. Burgel E, Oleck HG. Ueber die rechtsseitige paramediastinale Luftsichel bei Oberlappenschrumpfung. Rofo. 1960;93:160–163.
15. Woesner ME, Sanders I, White GW. The melting sign in resolving transient pulmonary infarction. Am J Roentgenol. 1971;111:782–790.
16. Hammond DI. The "ring around the artery" sign in pneumomediastinum. J Can Assoc Radiol. 1984;35:88–89.
17. Felson B, Felson H. Localization of intrathoracic lesions by means of the postero-anterior roentgenogram: the silhouette sign. Radiology. 1950;55:363–374.
18. Stark DD, Federle MP, Goodman PC, et al. Differentiating lung abscess and empyema: Radiography and computed tomography. Am J Roentgenol. 1983;141:163–167.
19. Westermark N. On the roentgen diagnosis of lung embolism. Acta Radiol. 1938;19:357–372.
P.33
20. Ely
JW, Berbaum KS, Bergus GR, et al. Diagnosing left lower lobe pneumonia:
usefulness of the ‘spine sign’ on lateral chest radiographs. J Fam Pract. 1996;43:242–248.
21. Müller NL, Miller RR, Webb WR, et al. Fibrosing alveolitis: CT-pathologic correlation. Radiology. 1986;160:585–588.
22. Kang EY, Grenier P, Laurent F, et al. Interlobular septal thickening: patterns at high-resolution computed tomography. J Thorac Imaging. 1996;11:260–264.
23. Gruden
JF, Webb WR, Naidich DP, et al. Multinodular disease; anatomic
localization at thin-section CT: multireader evaluation of a simple
algorithm. Radiology. 1999;210:711–720.
24. Austin
JHM, Müller NL, Friedman PJ, et al. Glossary of terms for CT of the
lungs: recommendations of the nomenclature committee of the Fleischner
Society. Radiology. 1996;200:327–331.
25. Leung AN, Miller RR, Müller NL. Parenchymal opacification in chronic infiltrative lung diseases: CT-pathologic correlation. Radiology. 1993;188:209–214.
26. Collins J, Stern EJ. Ground-glass opacity at CT: the ABCs. Am J Roentgenol. 1997;169:355–367.
27. Stern EJ, Webb WR. Dynamic imaging of lung morphology with ultrafast high-resolution computed tomography. J Thorac Imag. 1993;8:273–282.
28. Collins J, Blankenbaker D, Stern EJ. CT patterns of bronchiolar disease: what is "tree-in-bud"? Am J Roentgenol. 1998;171:365–370.
29. Aquino SL, Gamsu G, Webb WR, Kee ST. Tree-in-bud pattern: frequency and significance on thin section CT. J Comput Assist Tomogr. 1996;20:594–599.
30. Twining E, Kerley P. Textbook of X-Ray Diagnosis. 2nd ed. London: Lewis; 1951:208.
31. Im
JG, Itoh H, Shim YS, et al. Pulmonary tuberculosis: CT findings - early
active disease and sequential change with antituberculous therapy. Radiology. 1993;186:653–660.